Week 3: 23rd Sept – 27th Sept
This week was a turning point in the project. While the team had spent significant time brainstorming and experimenting with ideas, we realized that trying to fit all types of data into a single, unified solution was both impractical and creatively limiting. Frustration began to mount as differing opinions and approaches stalled progress.
A New Direction
In response to the challenges, I proposed a shift in our approach. Instead of forcing all data types into a singular experience, we would create data-specific VR experiences tailored to the nature of each dataset. For example, sleep data could have a more serene, environment-focused representation, while heart rate data could utilize dynamic and rhythmic visual elements. This new approach was well-received by the team, as it not only provided clarity but also allowed for more focused and creative ideation moving forward.
From this point on, we began brainstorming and prototyping experiences for individual data types, which reinvigorated our workflow and helped the team align more effectively.
Experimenting with Visuals
To bring our ideas to life, we started experimenting with visual representations and transitions. A key focus this week was creating an environment for sleep data that visually changes based on nightly metrics.
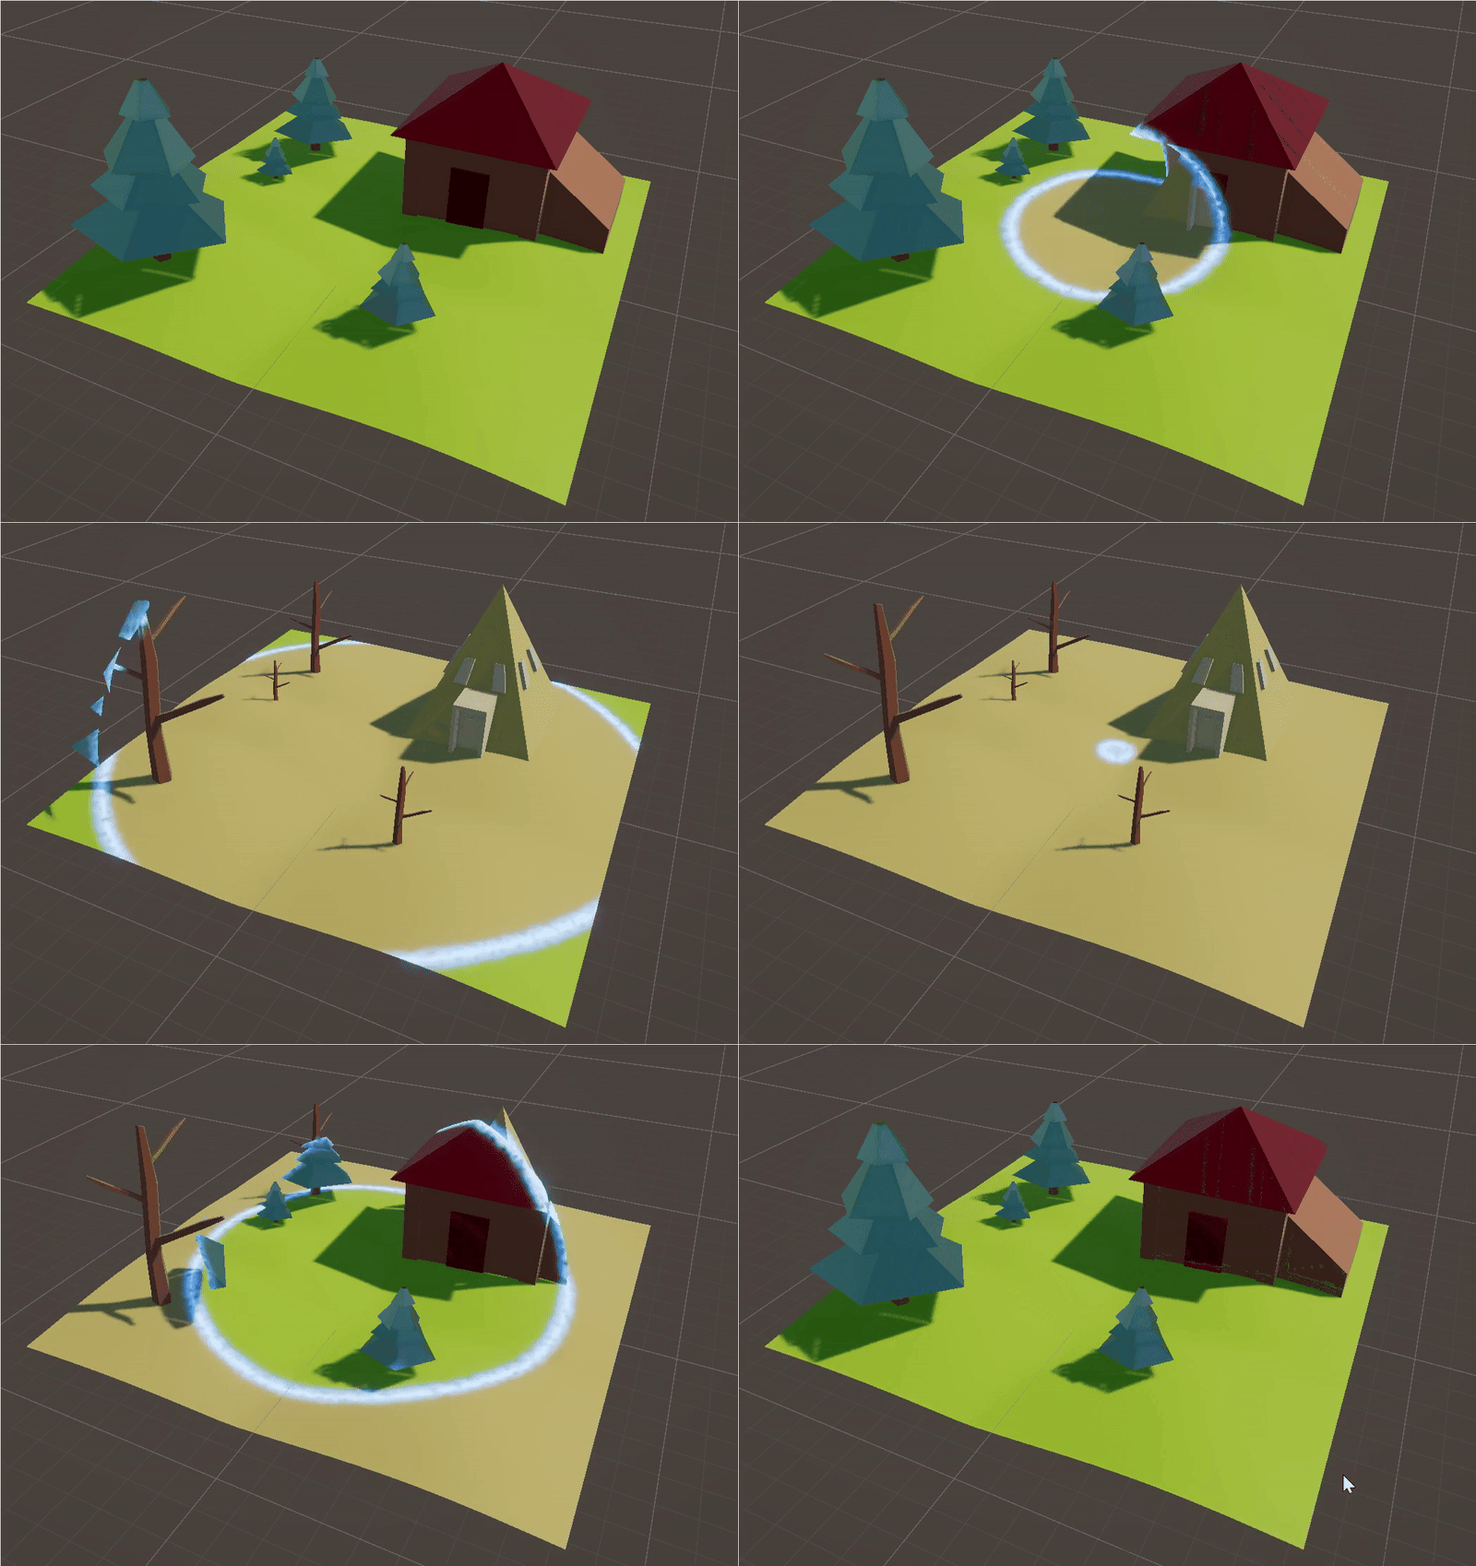
Transition ShaderFor smooth transitions between days of sleep data, I designed a transition shader using Blender’s shader nodes. My co-engineer translated this into Unity Shader Graph, marking the first step in achieving one of my learning goals: mastering shader development and procedural generation. While this was a small step, it laid the groundwork for more advanced shader tasks I plan to tackle in later stages of the project.
 Prototypes
We also developed small prototypes for the concepts produced during ideation. My contributions included:
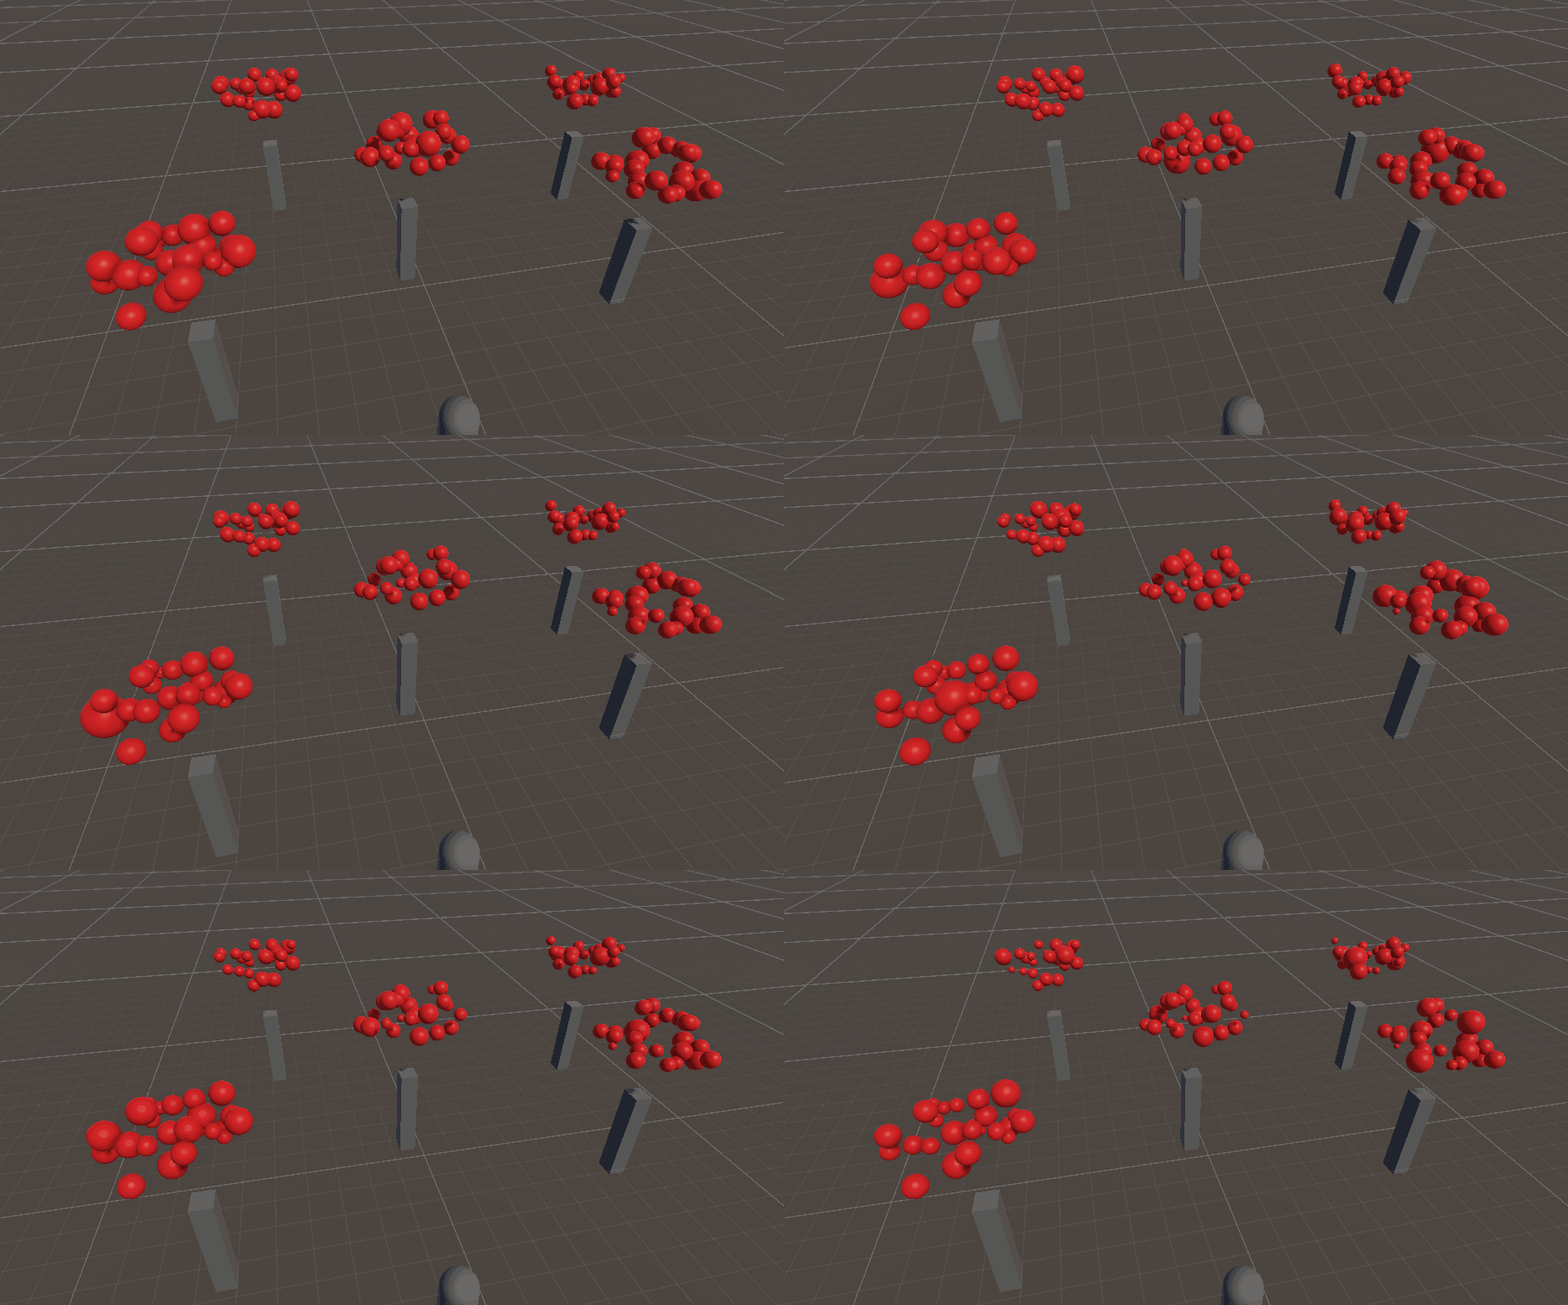
- Heart Rate Environment: This prototype visualized heart rate data using a tree with 24 fruits, each representing an hour of the day. The fruits would 'beat' rhythmically, mimicking a heartbeat, with their speed reflecting the bpm for the corresponding hour.

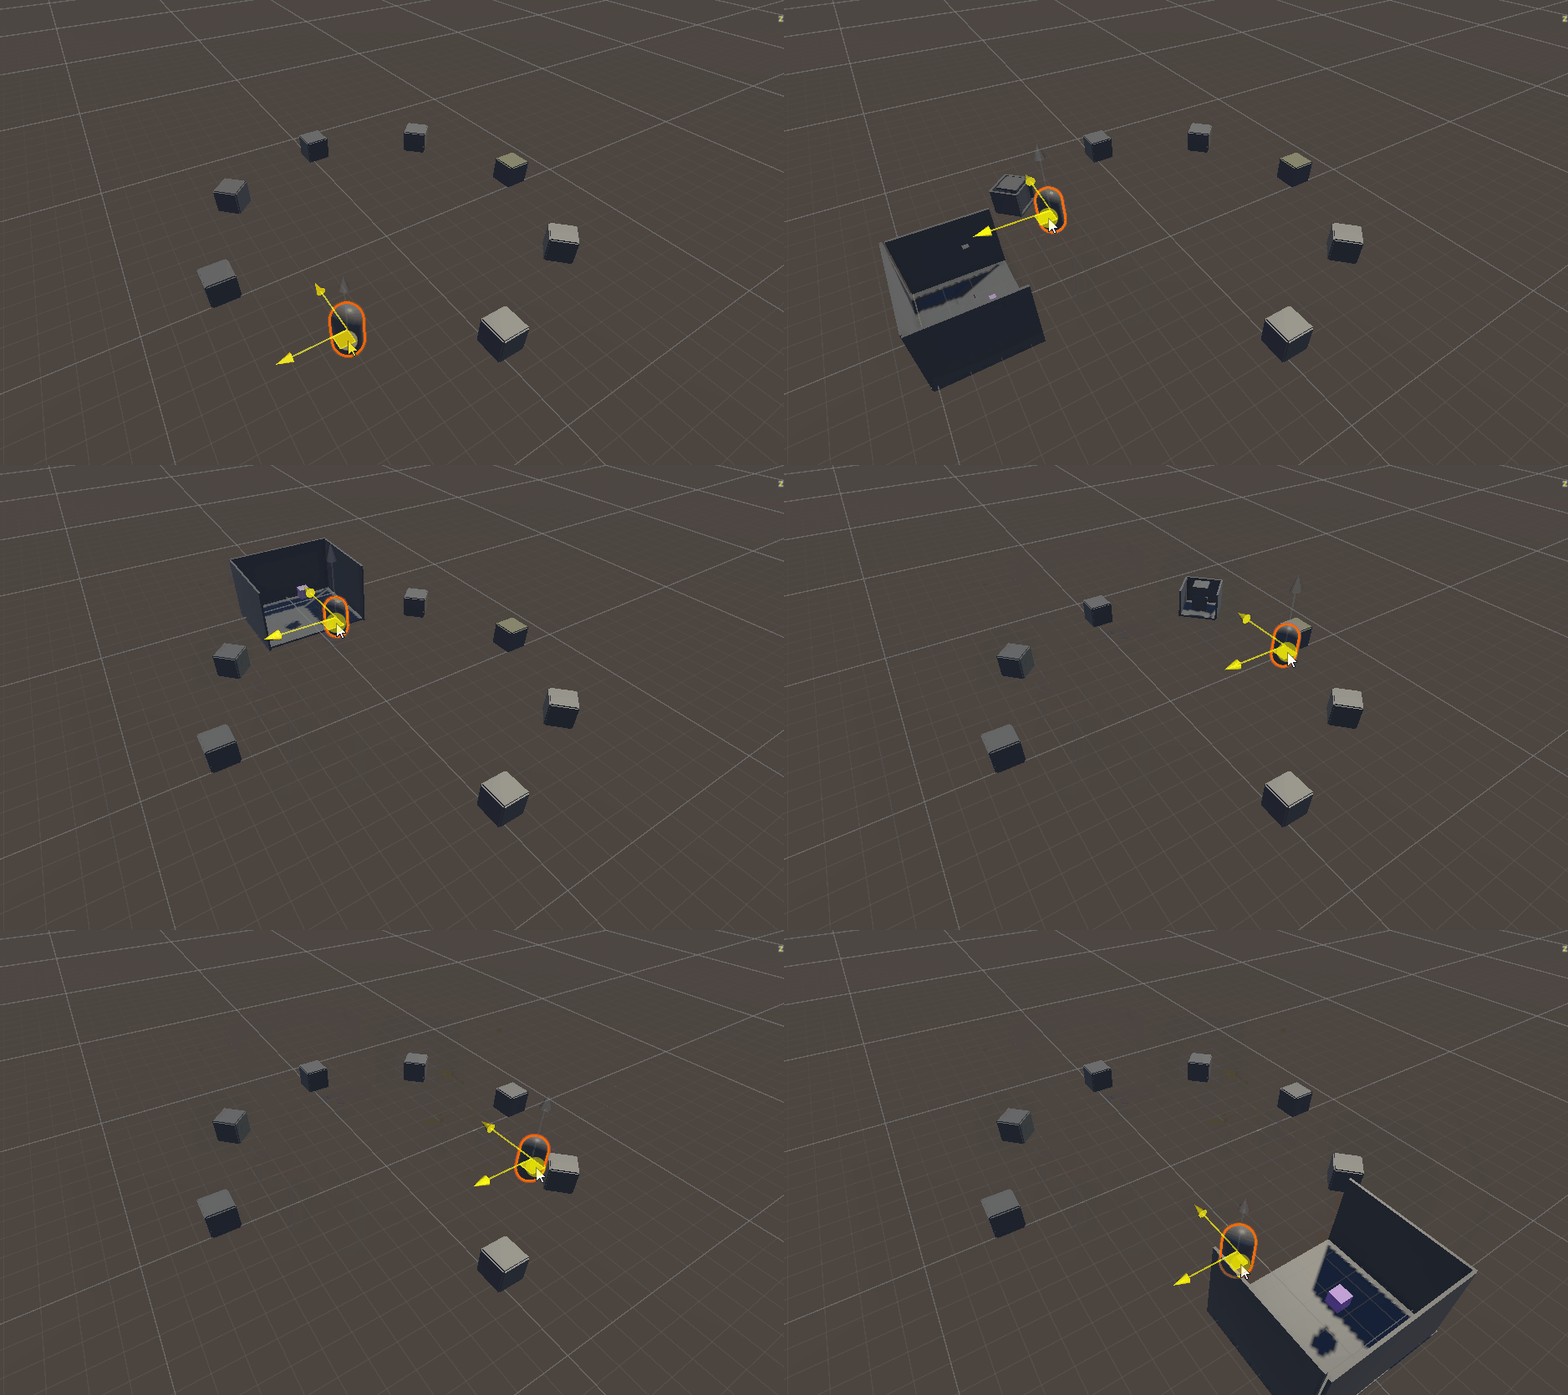
- Sleep Environment: This prototype featured points in the environment representing days of the week. As the user approached a point, it would 'open up' and display a representation of sample sleep data. For this prototype, the data was visualized as a cube moving randomly, with its speed corresponding to the quality of sleep for that night.

Meanwhile, my co-engineer worked on additional prototypes for other data types, ensuring that our new approach gained momentum.
Reflections
Week 3 was a mix of challenges and breakthroughs. While the lack of a solid concept early on was frustrating, the decision to create data-type-specific experiences provided a clear path forward and reunited the team. Experimenting with visuals and transitions gave us a taste of how the final product could look and feel, while the shader work marked the beginning of my journey toward mastering one of my key learning goals.
Looking ahead, I plan to delve deeper into Unity Shader Graph and procedural generation towards the end of the project where we need to polish the look and feel of our solution.
